The Available Best Control Performance
One of the primary metrics of control performance is variability. This value measures the the stattistical distance between the controlled and expected value.
Underperformance is represented by a single number.
The control performance audit focuses on best controllabiliy in order to minimise the variability of a process unit as a whole. The munltivariable dynamical response of the process is measured and the dynamical behaviour is redesigned for minimized interactions and for disturbance suppression. This approach moves the focus from single control loop to the overall performance of interactive processes like distillation columns, fermentation reactors or steam boilers.
Fully leverage the capabilities of your process control system
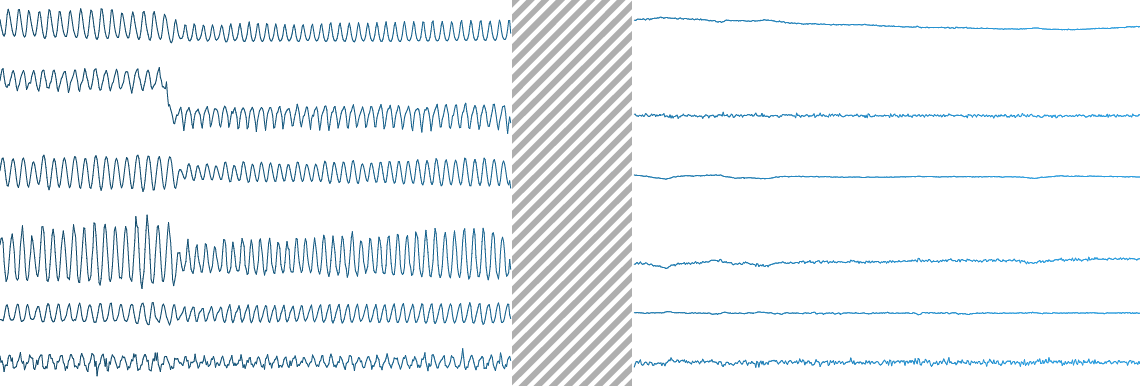
Our experience shows that complex interactive processes often suffer from control under performing due to the regulatory and technolgical process layer is dynamically mismatched. The most common sympthome is a periodic oscillation on controlled process parameters.
Oscillating systems are forced to operate far from optimum, while consuming excess energy under swinging periods, especially when they occur plant-wide.
There is a great benefit potential in solving the underperforming control issues.
Integration between process and control
A well-controlled process meets
minimum variability.
Utilize existing devices
Utilization of existing control system elements enables benefits without excess investments.
Best control performance
Maximized controllabilty is both the foundation and the opening of further avenues of optimization.
Consultancy
The foundation of a well performing control system is the same across all industries, any processes and control systems. There are specialities in each industry which are key to understanding the depth of a problem, but the control theory applies equally in all cases.
Feed Study
GAP analysis
The metrics show how far the current system is from desired, as well as the achievable control performance with the existing process and control devices.
Root Cause analysis
Each root cause that acts as a barrier againts the the best performance is localised and explored.
Corrective Actions
The necessary and sufficient action list provides adequate engineering activities in order to meet achievable performance.
Remote Data Analysis
Connect with us, based on your data supply we investigate your problem remotely and deliver the results.
Designed Control Response
Each closed control loop dynamical response are redesigned fo the entire process unit to achieve minimum variability as a whole. This redesign enables to defines multiple characteristics which finally ensures the unit well-controlled.
Minimum variability
Process value is close to the setpoint.
Non oscillatory
Not tending to swing
Responsive dynamics
Fast response with short settling time.
Disturbance tolerant
Disturbances are properly compensated.
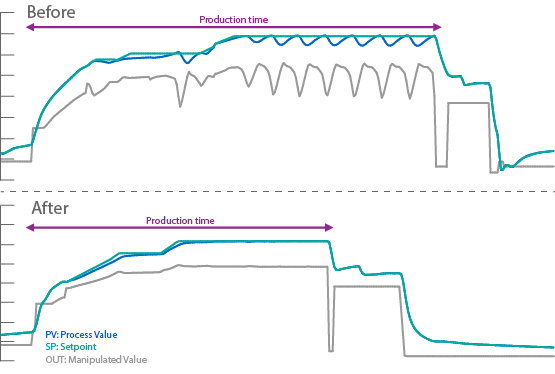
Stable and fast response
The time series data shows how the process is proven to work faster and more smoothly in accordance with the lead signal, after our services were applied.
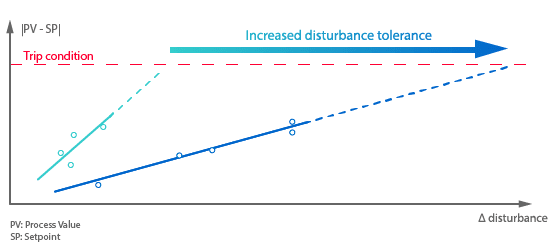
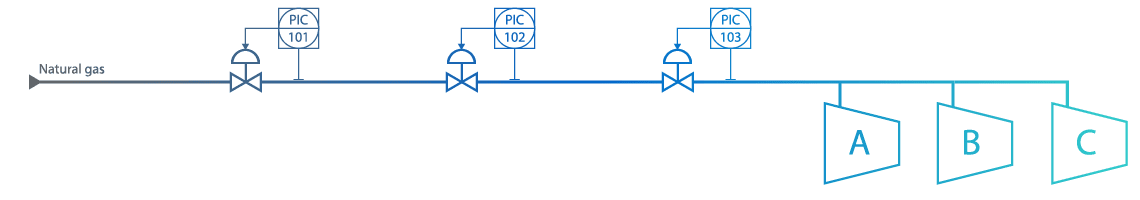
Trip prevention
When process is working operational incidents happen like feed material drops, process shut-downs and other severe disturbances. The process and control-related barriers are revealed and analysed in order to enable control response improvements.
Better compensation of operational disturbances
Setpoint changes of the pressure header originally caused trips, and operation was severely limited by trip conditions. After improvement the approved size of a step became greatly higher with appropriate compensation.
In thie case the the improvement resulted in significantly increased disturbance tolerance range.